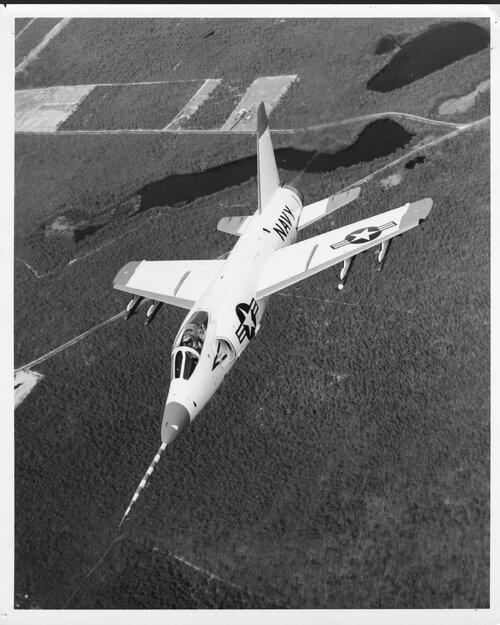
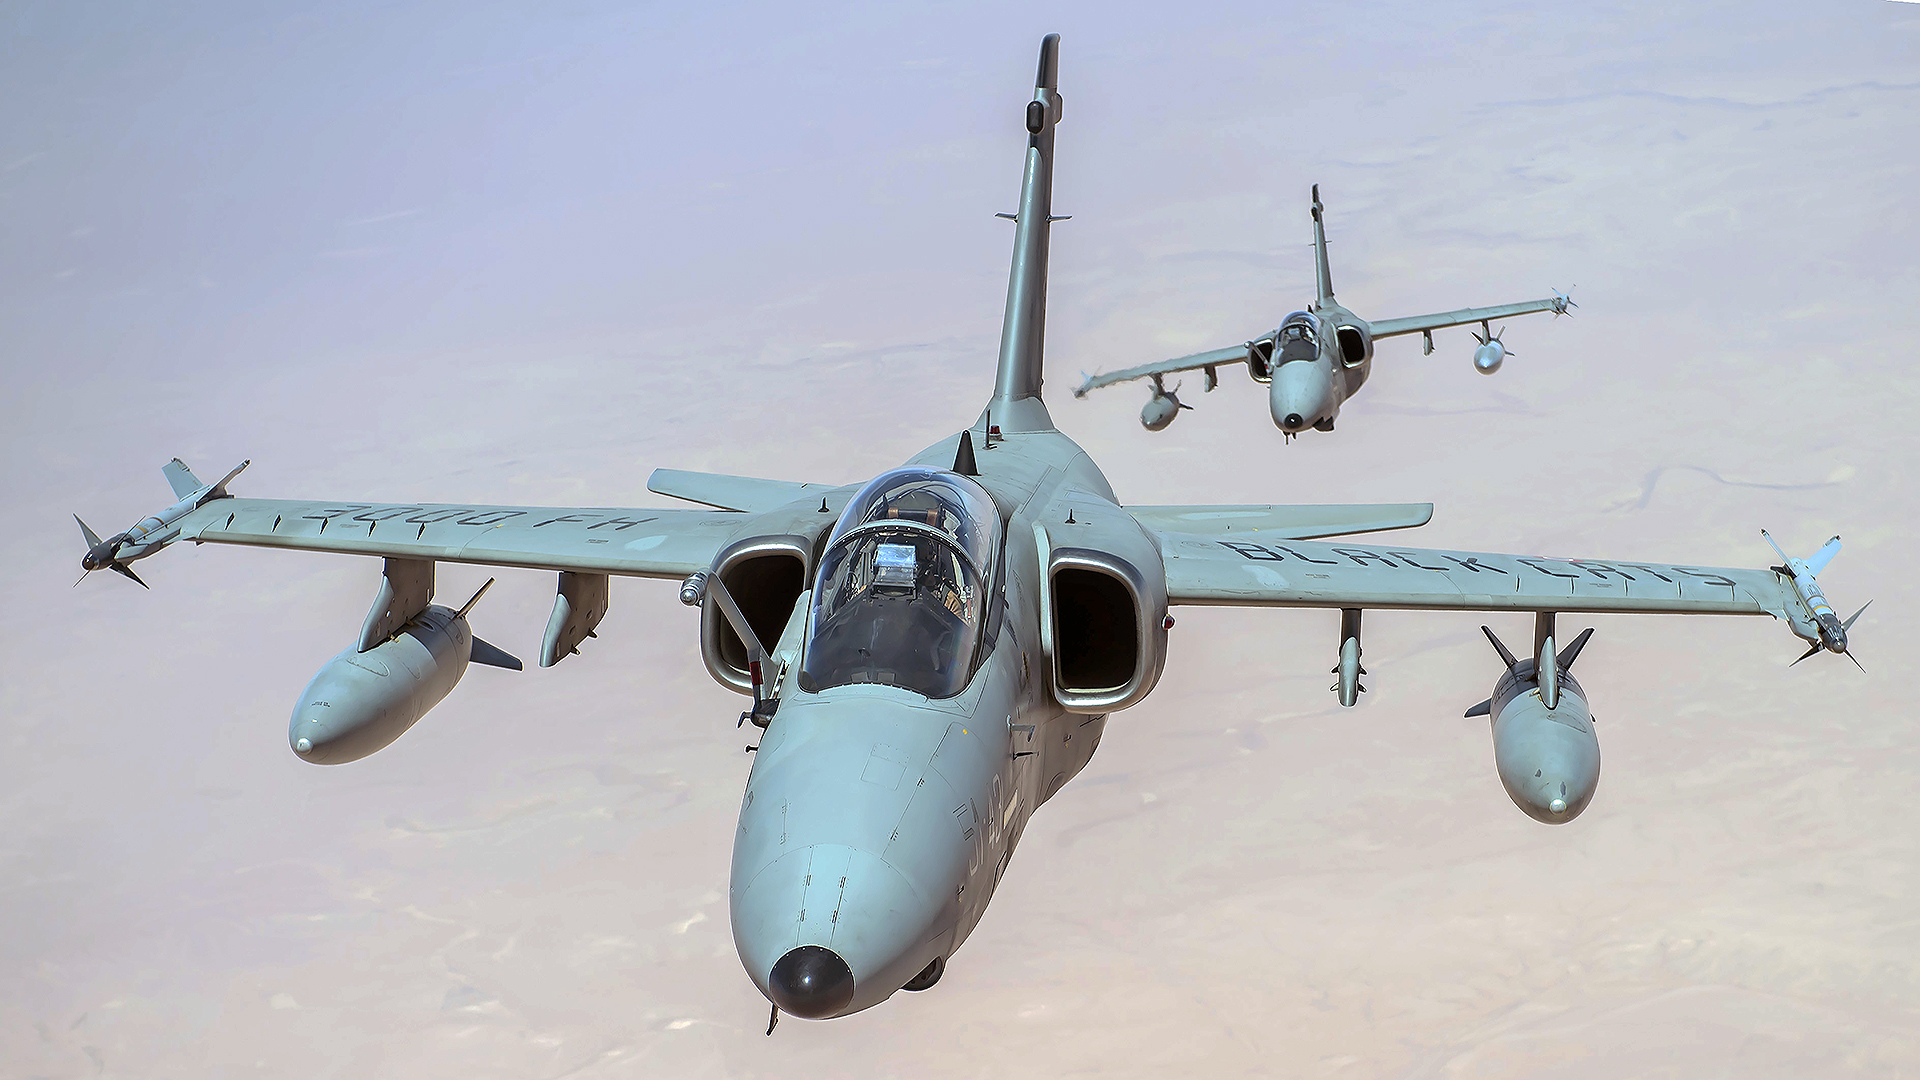
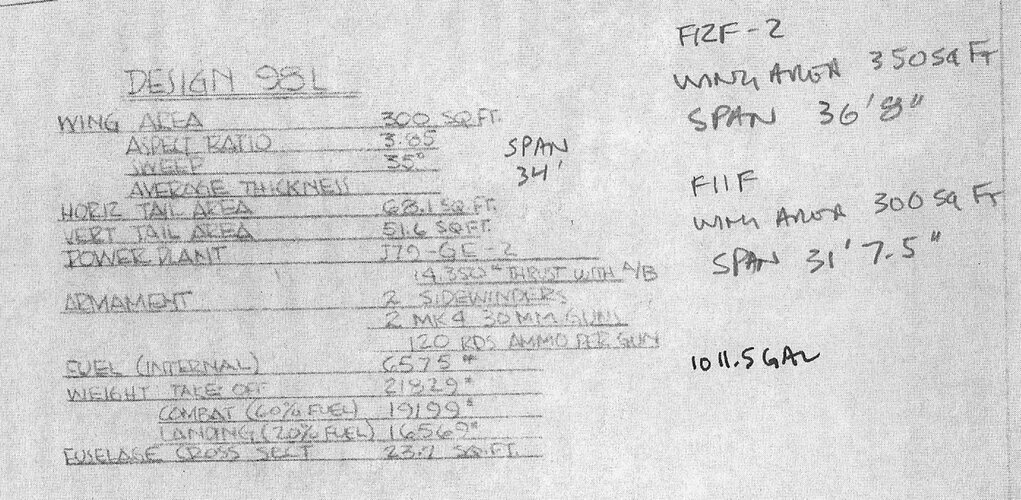
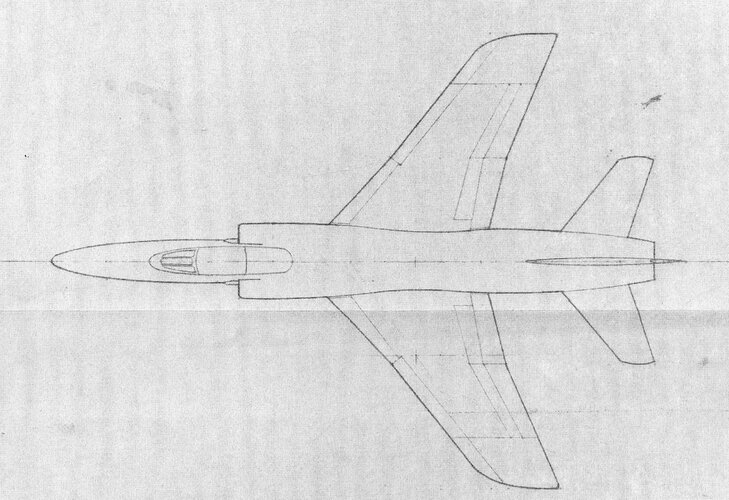
May as well post this... Decided to have Grok do some work on it. I have ZERO clue if any of this is accurate or some AI hallucinations but may as well put it up.
To estimate the performance of the Grumman F11F-1F Super Tiger with a Rolls-Royce Spey 205 turbofan engine (25,000 lbf wet thrust) and an increased wing area of 312 square feet (up from 250 square feet), we need to recalculate key performance metrics, accounting for changes in wing loading, drag, and thrust-to-drag characteristics. Below, I’ll outline the process, incorporating the effects of the larger wing area on aerodynamics and performance, and provide estimated thrust and drag curves based on available data and reasonable assumptions.
---
### 1. Baseline Assumptions and Modifications
From the previous analysis, the F11F-1F Super Tiger with the Spey 205 has:
- **Powerplant**: Rolls-Royce Spey 205 turbofan
- Dry thrust: ~12,500 lbf
- Wet thrust: 25,000 lbf
- **Weight** (adjusted for Spey’s lighter weight vs. J79):
- Empty: ~13,260 lb (13,810 lb - 550 lb for engine swap)
- Combat weight: ~20,900 lb
- Maximum takeoff weight: ~23,500 lb
- **Original Wing Area**: 250 sq ft
- **New Wing Area**: 312 sq ft (25% increase)
- **Airframe Modifications**: The Spey 205 requires larger intakes, adding ~200–500 lb. The wing area increase likely adds ~300–500 lb due to structural reinforcement, increasing empty weight to ~13,560–13,760 lb and combat weight to ~21,200–21,400 lb.
#### Wing Area Impact:
- **Wing Loading**:
- Original: 20,900 lb / 250 sq ft = 83.6 lb/sq ft (combat weight)
- New: 21,300 lb / 312 sq ft ≈ 68.3 lb/sq ft (assuming midpoint combat weight of 21,300 lb)
- A 18% reduction in wing loading improves low-speed handling, lift, and maneuverability but increases drag.
- **Lift Coefficient (C_L)**: The larger wing generates more lift at a given speed, potentially increasing the lift coefficient by ~25% (proportional to wing area increase), assuming similar airfoil characteristics.
- **Drag**: The larger wing increases parasite drag (C_D0) by ~15–20% due to greater surface area. Induced drag (C_Di) decreases slightly at low speeds due to lower wing loading but may increase at high speeds due to higher lift requirements.
---
### 2. Drag Estimation
Drag is calculated as:
\[ D = C_D \cdot \frac{1}{2} \rho V^2 S \]
where:
- \( C_D = C_{D0} + C_{Di} \): Total drag coefficient (parasite + induced)
- \( \rho \): Air density (0.0765 lb/ft³ at sea level, 0.0185 lb/ft³ at 40,000 ft)
- \( V \): Velocity (ft/s)
- \( S \): Wing area (312 sq ft)
#### Parasite Drag (C_D0):
- Original F11F-1F: Estimated C_D0 ≈ 0.013–0.015 (area-ruled fuselage, swept wings).
- New: With 25% larger wing area, C_D0 increases to ~0.016–0.018 due to increased wetted area.
#### Induced Drag (C_Di):
\[ C_{Di} = \frac{C_L^2}{e \cdot \pi \cdot AR} \]
- **Aspect Ratio (AR)**: Original AR ≈ 3.5 (based on wingspan ~31.9 ft, area 250 sq ft). Assuming the wingspan scales to maintain similar AR, new wingspan ≈ 35.7 ft, AR ≈ 3.5.
- **Oswald Efficiency (e)**: ~0.8 (typical for swept wings).
- **C_L**: Varies with speed and weight. At combat weight (21,300 lb) and 312 sq ft, C_L is lower at a given speed due to increased lift.
#### Drag Curve:
- **Low Speed (e.g., 300 mph or 440 ft/s at sea level)**:
- C_L ≈ 0.4 (lower due to larger wing).
- C_Di ≈ (0.4²) / (0.8 × π × 3.5) ≈ 0.007.
- Total C_D ≈ 0.016 + 0.007 = 0.023.
- Drag: \( D = 0.023 \cdot 0.5 \cdot 0.0765 \cdot 440^2 \cdot 312 \approx 5,400 lb \).
- **High Speed (e.g., 1,000 mph or 1,467 ft/s at sea level)**:
- C_L ≈ 0.12 (less lift needed at high speed).
- C_Di ≈ (0.12²) / (0.8 × π × 3.5) ≈ 0.002.
- Total C_D ≈ 0.018 + 0.002 = 0.020.
- Drag: \( D = 0.020 \cdot 0.5 \cdot 0.0765 \cdot 1467^2 \cdot 312 \approx 16,100 lb \).
- **Transonic/Supersonic (Mach 1.5–2.0 at 40,000 ft)**:
- Wave drag increases C_D0 to ~0.025–0.030 due to compressibility effects.
- Total C_D ≈ 0.027–0.032.
- Drag at Mach 2 (1,750 ft/s at 40,000 ft): \( D = 0.030 \cdot 0.5 \cdot 0.0185 \cdot 1750^2 \cdot 312 \approx 2,800 lb \).
The larger wing increases drag across the speed range, particularly at high speeds, requiring more thrust to achieve the same performance as the original configuration.
---
### 3. Thrust Curve
The Spey 205 provides:
- **Dry Thrust**: ~12,500 lbf (constant up to ~Mach 0.8, then decreases due to air density and ram effects).
- **Wet Thrust**: 25,000 lbf (available across the speed range, though slightly reduced at high altitudes due to lower air density).
Thrust varies with altitude and speed:
- **Sea Level**:
- Dry: 12,500 lbf
- Wet: 25,000 lbf
- **40,000 ft (Mach 2)**:
- Dry: ~5,000–6,000 lbf (reduced due to lower air density)
- Wet: ~18,000–20,000 lbf (afterburner efficiency drops at high altitude)
Thrust-to-drag ratio:
- At low speed (300 mph, sea level): 25,000 lbf / 5,400 lbf ≈ 4.6 (excellent for climb and acceleration).
- At high speed (1,000 mph, sea level): 25,000 lbf / 16,100 lbf ≈ 1.55 (sufficient for supersonic dash).
- At Mach 2 (40,000 ft): 18,000 lbf / 2,800 lbf ≈ 6.4 (high, but airframe limits cap speed).
---
### 4. Performance Estimates
Using the new wing area, reduced wing loading, and updated drag/thrust characteristics, we recalculate performance:
- **Maximum Speed**:
- **At 40,000 ft**: The original Spey-powered estimate was Mach 1.9–2.0, limited by the turbofan’s lower exhaust velocity and airframe drag. The larger wing increases drag by ~15–20%, reducing maximum speed to ~Mach 1.8–1.95 (1,230–1,330 mph or 1,980–2,140 km/h). The thrust-to-drag ratio at Mach 2 (~6.4) suggests the aircraft can approach but not exceed the original J79’s Mach 2.04 due to increased drag.
- **At Sea Level**: Original estimate was Mach 1.6–1.7 (950–1,000 mph). Increased drag reduces this to ~Mach 1.5–1.6 (900–950 mph or 1,450–1,530 km/h), as thrust (25,000 lbf) is partially offset by ~16,100 lbf drag at high speed.
- **Rate of Climb**:
- Original Spey estimate: 12,000–13,500 ft/min. Lower wing loading (68.3 lb/sq ft vs. 83.6 lb/sq ft) improves climb performance by ~10–15%. New estimate: ~13,200–15,500 ft/min (67–79 m/s), driven by high thrust-to-weight ratio (1.17 at 21,300 lb) and better low-speed lift.
- **Service Ceiling**:
- Original Spey estimate: 52,000–55,000 ft. The larger wing’s improved lift allows a higher service ceiling, estimated at ~54,000–57,000 ft (16,460–17,370 m). Zoom climb potential increases to ~82,000–85,000 ft due to better lift retention in climb profiles.
- **Range**:
- Original Spey estimate: 1,350–1,500 miles (internal fuel). The larger wing increases drag, reducing range by ~5–10% due to higher fuel consumption at cruise. New estimate: ~1,280–1,425 miles (2,060–2,290 km). With drop tanks, range is ~1,500–1,700 miles.
- **Acceleration and Maneuverability**:
- Thrust-to-weight ratio: 25,000 lbf / 21,300 lb ≈ 1.17 (slightly lower than 1.20 due to weight increase). Acceleration remains excellent, with ~20–25% reduction in time to Mach 1 compared to the J79.
- Lower wing loading improves turn rate and sustained maneuverability by ~15–20%, making the aircraft more agile at subsonic speeds. High-speed maneuverability is slightly reduced due to increased drag.
- **Takeoff and Landing**:
- Takeoff: The Spey’s 25,000 lbf thrust and lower wing loading reduce takeoff distance to ~1,800–2,100 ft (from ~2,100–2,400 ft), a ~10–15% improvement due to better lift.
- Landing: Lower wing loading reduces stall speed by ~10% (from ~120 mph to ~108 mph), improving carrier approach handling.
---
### 5. Challenges and Limitations
- **Increased Drag**: The 25% larger wing area significantly increases parasite drag, limiting top speed and slightly reducing range despite the Spey’s better SFC.
- **Structural Weight**: The wing area increase adds ~300–500 lb, partially offsetting the Spey’s weight savings. Structural reinforcement may limit further performance gains.
- **Carrier Operations**: The reduced takeoff distance and stall speed improve carrier compatibility, but larger intakes and wingspan may complicate deck handling.
- **Supersonic Performance**: The Spey’s turbofan design and higher drag cap maximum speed below the J79’s Mach 2.04, despite higher thrust.
---
### 6. Comparison to Contemporaries
- **F-104 Starfighter**: The Spey-powered Super Tiger with larger wings has better low-speed maneuverability and climb rate but lower top speed (Mach 1.8–1.95 vs. F-104’s Mach 2.0) due to increased drag.
- **F8U Crusader**: The modified Super Tiger retains a significant edge in speed, climb, and range, with improved low-speed handling making it more versatile for carrier operations.
---
### 7. Thrust and Drag Curves (Simplified)
Below is a simplified representation of thrust and drag vs. speed at sea level and 40,000 ft (numerical estimates, not plotted):
- **Sea Level**:
- Thrust (wet): 25,000 lbf (constant up to Mach 0.8, slight drop to ~24,000 lbf at Mach 1.5).
- Drag: 5,400 lbf (300 mph), 16,100 lbf (1,000 mph).
- Thrust-to-drag ratio peaks at low speed (~4.6) and drops to ~1.5 at Mach 1.5.
- **40,000 ft**:
- Thrust (wet): ~18,000–20,000 lbf at Mach 1.8–2.0.
- Drag: ~2,800 lbf at Mach 2.
- Thrust-to-drag ratio ~6.4 at Mach 2, but airframe limits speed.
---
### 8. Conclusion
The Grumman F11F-1F Super Tiger with a Spey 205 turbofan and 312 sq ft wing area would perform as follows:
- **Maximum Speed**: ~Mach 1.8–1.95 (1,230–1,330 mph) at 40,000 ft; ~Mach 1.5–1.6 (900–950 mph) at sea level
- **Rate of Climb**: ~13,200–15,500 ft/min
- **Service Ceiling**: ~54,000–57,000 ft; zoom climb to ~82,000–85,000 ft
- **Range**: ~1,280–1,425 miles (internal fuel); ~1,500–1,700 miles with drop tanks
- **Thrust-to-Weight Ratio**: ~1.17, with excellent acceleration
- **Takeoff Distance**: ~1,800–2,100 ft
- **Maneuverability**: Improved subsonic agility due to lower wing loading (68.3 lb/sq ft)
The larger wing improves low-speed performance, climb rate, and carrier suitability but reduces top speed and range due to higher drag. The aircraft remains competitive with contemporaries like the F-104 and F8U, excelling in versatility but falling short of Mach 2 due to aerodynamic and engine limitations.
---
### Sources
- Grumman F11F-1F Super Tiger - Wikipedia
- Grumman F11F-2 Super Tiger | This Day in Aviation
- Did the Navy and the world miss out on the F11F-1F Super Tiger | WW2Aircraft.net Forums
- The Tiger: Grumman’s F11F Was The First Supersonic Cat | Avgeekery.com
- General aerodynamic principles and engine performance data (J79, Spey)
If you need detailed calculations (e.g., specific C_L/C_D curves, plotted thrust/drag graphs), please specify, and I can provide further analysis or suggest a visualization approach!
To evaluate the effect of boundary layer control (BLC), specifically "blown flaps," on the Grumman F11F-1F Super Tiger with the Rolls-Royce Spey 205 turbofan (25,000 lbf wet thrust) at both the original wing area of 250 square feet and the modified wing area of 312 square feet, we’ll focus on the impact on takeoff and landing speeds, as well as related performance metrics like takeoff distance and stall speed. Blown flaps use high-pressure air bled from the engine to energize the boundary layer over the wing and flaps, increasing lift at low speeds, which is particularly beneficial for carrier-based aircraft. Below, I’ll outline the methodology, assumptions, and recalculated performance for both wing configurations.
---
### 1. Understanding Blown Flaps and Boundary Layer Control
Blown flaps direct high-pressure engine bleed air over the wing’s trailing-edge flaps, delaying boundary layer separation and increasing the lift coefficient (C_L) at high angles of attack (AOA). This allows:
- **Higher C_Lmax**: Increases maximum lift coefficient, reducing stall speed and takeoff/landing speeds.
- **Lower Drag at High Lift**: Improves lift-to-drag ratio at low speeds, enhancing takeoff and landing performance.
- **Carrier Suitability**: Reduces approach speeds and takeoff distances, critical for operations on smaller carriers.
For the F11F-1F, blown flaps would likely use compressor bleed air from the Spey 205, similar to systems on aircraft like the F-4 Phantom II (which used BLC on its leading-edge slats) or the Lockheed F-104 Starfighter. Typical effects of blown flaps include:
- **C_Lmax Increase**: ~20–50% higher than standard flaps, depending on bleed air pressure and flap design.
- **Stall Speed Reduction**: Proportional to the square root of the C_Lmax increase (since \( V_{\text{stall}} \propto \sqrt{\frac{2W}{\rho S C_{Lmax}}} \)).
- **Thrust Penalty**: Bleed air reduces available thrust by ~5–10% during takeoff/landing, though the Spey’s high thrust (25,000 lbf wet) mitigates this.
- **Drag**: Slightly higher drag at low speeds due to extended flaps, but the lift increase outweighs this for takeoff/landing.
---
### 2. Baseline Super Tiger Specifications
From prior analyses:
- **Powerplant**: Rolls-Royce Spey 205 (12,500 lbf dry, 25,000 lbf wet)
- **Weight**:
- Empty: ~13,260 lb (250 sq ft); ~13,560–13,760 lb (312 sq ft, with ~300–500 lb added for larger wings)
- Combat weight: ~20,900 lb (250 sq ft); ~21,200–21,400 lb (312 sq ft, midpoint 21,300 lb)
- Max takeoff weight: ~23,500 lb (both configurations)
- **Wing Area**:
- Original: 250 sq ft (wing loading ~83.6 lb/sq ft at 20,900 lb)
- Modified: 312 sq ft (wing loading ~68.3 lb/sq ft at 21,300 lb)
- **Baseline Performance (without BLC)**:
- **250 sq ft**:
- Takeoff distance: ~2,100–2,400 ft
- Stall speed: ~120 mph (estimated, based on typical C_Lmax ≈ 1.4 for swept wings with flaps)
- Landing speed: ~130–140 mph (slightly above stall speed for carrier approach)
- **312 sq ft**:
- Takeoff distance: ~1,800–2,100 ft
- Stall speed: ~108 mph (lower due to reduced wing loading)
- Landing speed: ~118–128 mph
---
### 3. Assumptions for Blown Flaps
- **C_Lmax Increase**: Blown flaps typically increase C_Lmax by 20–50%. For a swept-wing fighter with standard flaps (C_Lmax ≈ 1.4), blown flaps could raise C_Lmax to ~1.7–2.1. We’ll assume a conservative 30% increase (C_Lmax ≈ 1.82) for the Super Tiger, based on systems like the F-4’s BLC.
- **Thrust Penalty**: Bleed air for BLC reduces thrust by ~7% (typical for blown flap systems). Wet thrust drops from 25,000 lbf to ~23,250 lbf during takeoff/landing.
- **Drag Impact**: Blown flaps increase drag slightly (C_D ≈ 0.05–0.07 with flaps down), but the lift gain dominates for takeoff/landing performance.
- **Airframe Modifications**: Minimal structural changes are assumed, as the F11F-1F’s wing can accommodate flap modifications. Weight increase is negligible (~50–100 lb for ducting/piping).
- **Carrier Operations**: Landing speeds are critical for carrier approaches, typically 10–20 mph above stall speed to ensure control margin.
---
### 4. Performance Calculations
We’ll recalculate takeoff and landing speeds, takeoff distance, and landing distance for both wing areas, factoring in blown flaps.
#### Stall Speed Formula
\[ V_{\text{stall}} = \sqrt{\frac{2W}{\rho S C_{Lmax}}} \]
- \( W \): Weight (use combat weight: 20,900 lb for 250 sq ft, 21,300 lb for 312 sq ft)
- \( \rho \): Air density (0.0765 lb/ft³ at sea level)
- \( S \): Wing area (250 or 312 sq ft)
- \( C_{Lmax} \):
- Without BLC: ~1.4 (standard flaps)
- With BLC: ~1.82 (30% increase)
#### Takeoff and Landing Speeds
- **Takeoff Speed**: Typically ~1.2 × V_{\text{stall}} for carrier fighters.
- **Landing Speed**: Typically ~1.1–1.2 × V_{\text{stall}} for carrier approaches.
##### 250 sq ft Wing (Without BLC)
- **Stall Speed**:
\[ V_{\text{stall}} = \sqrt{\frac{2 \cdot 20,900}{0.0765 \cdot 250 \cdot 1.4}} \approx \sqrt{\frac{41,800}{26.775}} \approx \sqrt{1,561} \approx 39.5 \, \text{m/s} \approx 88.3 \, \text{mph} \]
- **Takeoff Speed**: \( 1.2 \cdot 88.3 \approx 106 \, \text{mph} \)
- **Landing Speed**: \( 1.15 \cdot 88.3 \approx 101.5 \, \text{mph} \)
##### 250 sq ft Wing (With BLC)
- **Stall Speed**:
\[ V_{\text{stall}} = \sqrt{\frac{2 \cdot 20,900}{0.0765 \cdot 250 \cdot 1.82}} \approx \sqrt{\frac{41,800}{34.7625}} \approx \sqrt{1,202} \approx 34.7 \, \text{m/s} \approx 77.6 \, \text{mph} \]
- Reduction: \( \sqrt{\frac{1.4}{1.82}} \approx 0.877 \), or ~12.3% lower stall speed.
- **Takeoff Speed**: \( 1.2 \cdot 77.6 \approx 93.1 \, \text{mph} \)
- **Landing Speed**: \( 1.15 \cdot 77.6 \approx 89.2 \, \text{mph} \)
##### 312 sq ft Wing (Without BLC)
- **Stall Speed**:
\[ V_{\text{stall}} = \sqrt{\frac{2 \cdot 21,300}{0.0765 \cdot 312 \cdot 1.4}} \approx \sqrt{\frac{42,600}{33.426}} \approx \sqrt{1,274} \approx 35.7 \, \text{m/s} \approx 79.8 \, \text{mph} \]
- **Takeoff Speed**: \( 1.2 \cdot 79.8 \approx 95.8 \, \text{mph} \)
- **Landing Speed**: \( 1.15 \cdot 79.8 \approx 91.8 \, \text{mph} \)
##### 312 sq ft Wing (With BLC)
- **Stall Speed**:
\[ V_{\text{stall}} = \sqrt{\frac{2 \cdot 21,300}{0.0765 \cdot 312 \cdot 1.82}} \approx \sqrt{\frac{42,600}{43.429}} \approx \sqrt{981} \approx 31.3 \, \text{m/s} \approx 70.0 \, \text{mph} \]
- Reduction: ~12.3% lower stall speed.
- **Takeoff Speed**: \( 1.2 \cdot 70.0 \approx 84.0 \, \text{mph} \)
- **Landing Speed**: \( 1.15 \cdot 70.0 \approx 80.5 \, \text{mph} \)
#### Takeoff Distance
Takeoff distance depends on thrust, weight, and lift. The formula is approximated as:
\[ d \propto \frac{W^2}{T \cdot S \cdot C_{L}} \]
- **Thrust (T)**: Reduced to 23,250 lbf with BLC (7% penalty).
- **C_L**: ~1.4 (without BLC), ~1.82 (with BLC) at takeoff AOA.
- **Baseline Distances** (from prior analysis):
- 250 sq ft: 2,100–2,400 ft
- 312 sq ft: 1,800–2,100 ft
- **With BLC**:
- C_L increase (1.82/1.4 ≈ 1.3) reduces distance by ~23% (since \( d \propto 1/C_L \)).
- Thrust reduction (~7%) increases distance by ~7.5% (since \( d \propto 1/T \)).
- Net effect: ~16–18% reduction in takeoff distance.
- **Estimates**:
- **250 sq ft**: 2,100–2,400 ft → ~1,750–2,000 ft
- **312 sq ft**: 1,800–2,100 ft → ~1,500–1,750 ft
#### Landing Distance
Landing distance is reduced due to lower approach speeds and higher lift. Assuming similar braking and aerodynamic drag:
- **Baseline** (without BLC):
- 250 sq ft: ~2,500–3,000 ft (carrier deck, with arresting gear)
- 312 sq ft: ~2,200–2,700 ft
- **With BLC**: Lower landing speeds (~12% reduction) reduce landing distance by ~20–25% (since \( d \propto V^2 \)).
- **Estimates**:
- **250 sq ft**: ~2,000–2,400 ft
- **312 sq ft**: ~1,750–2,150 ft
---
### 5. Summary of Performance with Blown Flaps
| Metric | 250 sq ft (No BLC) | 250 sq ft (BLC) | 312 sq ft (No BLC) | 312 sq ft (BLC) |
|--------|---------------------|-----------------|---------------------|-----------------|
| **Stall Speed** | 88.3 mph | 77.6 mph | 79.8 mph | 70.0 mph |
| **Takeoff Speed** | 106 mph | 93.1 mph | 95.8 mph | 84.0 mph |
| **Landing Speed** | 101.5 mph | 89.2 mph | 91.8 mph | 80.5 mph |
| **Takeoff Distance** | 2,100–2,400 ft | 1,750–2,000 ft | 1,800–2,100 ft | 1,500–1,750 ft |
| **Landing Distance** | 2,500–3,000 ft | 2,000–2,400 ft | 2,200–2,700 ft | 1,750–2,150 ft |
#### Key Observations:
- **250 sq ft Wing**:
- Blown flaps reduce stall speed by ~12.3% (88.3 → 77.6 mph), takeoff speed by ~12% (106 → 93.1 mph), and landing speed by ~12% (101.5 → 89.2 mph).
- Takeoff distance decreases by ~16–18% (2,100–2,400 ft → 1,750–2,000 ft).
- Landing distance decreases by ~20% (2,500–3,000 ft → 2,000–2,400 ft).
- **312 sq ft Wing**:
- Blown flaps reduce stall speed by ~12.3% (79.8 → 70.0 mph), takeoff speed by ~12% (95.8 → 84.0 mph), and landing speed by ~12% (91.8 → 80.5 mph).
- Takeoff distance decreases by ~16–18% (1,800–2,100 ft → 1,500–1,750 ft).
- Landing distance decreases by ~20% (2,200–2,700 ft → 1,750–2,150 ft).
- **Comparison**: The 312 sq ft wing with BLC offers the lowest speeds and distances due to its lower wing loading (68.3 lb/sq ft vs. 83.6 lb/sq ft) and higher lift from blown flaps, making it exceptionally carrier-friendly.
---
### 6. Impact on Carrier Operations
- **250 sq ft with BLC**: Landing speed (~89.2 mph) is comparable to the F9F Panther (~85–90 mph), suitable for smaller carriers like the Essex class. Takeoff distance (~1,750–2,000 ft) is excellent for short carrier decks.
- **312 sq ft with BLC**: Landing speed (~80.5 mph) is among the lowest for supersonic fighters, rivaling subsonic jets like the A-4 Skyhawk (~75–80 mph). Takeoff distance (~1,500–1,750 ft) is ideal for carrier operations, enhancing safety and operational flexibility.
---
### 7. Other Performance Considerations
- **Maneuverability**: Blown flaps improve low-speed handling, increasing turn rate and reducing minimum turn radius, especially for the 312 sq ft wing, which already benefits from lower wing loading.
- **Thrust Penalty**: The ~7% thrust reduction during BLC operation slightly impacts acceleration during takeoff, but the Spey’s high thrust (23,250 lbf with BLC) ensures performance remains robust.
- **High-Speed Performance**: Blown flaps are primarily used during takeoff/landing and do not significantly affect high-speed drag or thrust curves (as calculated previously).
---
### 8. Comparison to F-4 Phantom II
From the prior comparison, the F-4B Phantom II (530 sq ft wing, 34,000 lbf wet thrust) has:
- **Stall Speed**: ~130–140 mph (C_Lmax ≈ 1.5 with BLC on leading-edge slats)
- **Takeoff Speed**: ~150–160 mph
- **Landing Speed**: ~140–150 mph
- **Takeoff Distance**: ~4,000 ft
- **Landing Distance**: ~3,000–3,500 ft (with arresting gear)
**With BLC**:
- **Super Tiger (250 sq ft)**: Superior to the F-4B in takeoff (1,750–2,000 ft vs. 4,000 ft) and landing speeds (89.2 mph vs. 140–150 mph), making it far more carrier-friendly.
- **Super Tiger (312 sq ft)**: Even better, with landing speeds (~80.5 mph) approaching subsonic jets and takeoff distances (1,500–1,750 ft) ideal for smaller carriers.
- **Analysis**: The Super Tiger with blown flaps outperforms the F-4B in carrier operations, especially with the 312 sq ft wing, but the F-4B’s multirole capability and higher top speed (Mach 2.23) remain advantages.
---
### 9. Conclusion
Blown flaps significantly enhance the F11F-1F Super Tiger’s takeoff and landing performance:
- **250 sq ft Wing**: Reduces stall speed to 77.6 mph, takeoff speed to 93.1 mph, landing speed to 89.2 mph, takeoff distance to 1,750–2,000 ft, and landing distance to 2,000–2,400 ft.
- **312 sq ft Wing**: Reduces stall speed to 70.0 mph, takeoff speed to 84.0 mph, landing speed to 80.5 mph, takeoff distance to 1,500–1,750 ft, and landing distance to 1,750–2,150 ft.
- The 312 sq ft wing with BLC is exceptionally suited for carrier operations, with landing speeds rivaling subsonic jets and takeoff distances ideal for small carriers.
- Compared to the F-4B, the Super Tiger with BLC is superior in carrier suitability but remains a specialized air superiority fighter, lacking the F-4’s multirole versatility.
If you need further details (e.g., specific C_L curves, detailed drag impacts, or visualizations), let me know!
Had it run one with dual BLC.
Let’s dive into enhancing the Grumman F11F-1F Super Tiger’s performance by adding boundary layer control (BLC) to the leading-edge slats, in addition to the previously analyzed blown flaps on the trailing-edge flaps. This dual BLC system—blowing high-pressure air over both leading-edge slats and trailing-edge flaps—further increases lift at low speeds by delaying boundary layer separation across the entire wing. We’ll build on the prior analysis, focusing on how this affects takeoff and landing speeds, stall speed, takeoff distance, and landing distance for both the original 250 sq ft wing and the modified 312 sq ft wing, powered by the Rolls-Royce Spey 205 turbofan (25,000 lbf wet thrust). Below, I’ll outline the methodology, assumptions, and updated performance estimates.
---
### 1. Understanding Dual BLC (Blown Flaps + Blown Slats)
BLC on leading-edge slats, as seen in aircraft like the F-4 Phantom II, uses engine bleed air to energize the boundary layer at the wing’s leading edge, increasing lift at high angles of attack (AOA) by delaying stall. Combining this with blown flaps creates a synergistic effect:
- **Leading-Edge Slats BLC**: Increases the critical AOA, allowing higher C_Lmax by preventing flow separation at the wing’s leading edge. This is especially effective for swept wings like the Super Tiger’s, which are prone to tip stall.
- **Trailing-Edge Flaps BLC**: Enhances lift by delaying separation over the flaps, as previously analyzed.
- **Combined Effect**: Dual BLC can increase C_Lmax by 40–70% over a clean wing, compared to 20–50% for blown flaps alone, due to improved flow control across the entire wing chord.
**Assumptions for Dual BLC**:
- **C_Lmax Increase**: Blown flaps alone increased C_Lmax from 1.4 to 1.82 (~30%). Adding BLC to slats could push C_Lmax to ~2.0–2.3. We’ll assume a conservative 50% total increase over the baseline (C_Lmax ≈ 2.1), aligning with aircraft like the F-4B (C_Lmax ≈ 1.5–2.0 with slat BLC).
- **Thrust Penalty**: BLC on both slats and flaps requires more bleed air, increasing the thrust penalty to ~10–12% (vs. 7% for flaps alone). Wet thrust drops from 25,000 lbf to ~22,250 lbf during takeoff/landing.
- **Drag Impact**: Slightly higher drag (C_D ≈ 0.06–0.08 with slats and flaps extended) due to increased surface area and airflow disruption, but the lift gain dominates low-speed performance.
- **Weight Increase**: Adding BLC to slats requires additional ducting and actuators, adding ~100–150 lb (total ~150–250 lb for dual BLC system).
- **Airframe Modifications**: The F11F-1F’s leading-edge slats can be modified for BLC with minimal structural changes, as the wing already supports slat mechanisms.
---
### 2. Baseline Specifications (Recap)
From the prior analysis:
- **Powerplant**: Rolls-Royce Spey 205 (12,500 lbf dry, 25,000 lbf wet, reduced to 22,250 lbf with dual BLC).
- **Weight**:
- **250 sq ft wing**: Combat weight ~20,900 lb (add ~200 lb for dual BLC → 21,100 lb).
- **312 sq ft wing**: Combat weight ~21,300 lb (add ~200 lb → 21,500 lb).
- Max takeoff weight: ~23,500 lb (both, adjusted to ~23,700 lb with BLC).
- **Wing Area**:
- Original: 250 sq ft (wing loading ~84.4 lb/sq ft at 21,100 lb).
- Modified: 312 sq ft (wing loading ~68.9 lb/sq ft at 21,500 lb).
- **Baseline Performance (with Blown Flaps Only)**:
- **250 sq ft**:
- Stall speed: 77.6 mph
- Takeoff speed: 93.1 mph
- Landing speed: 89.2 mph
- Takeoff distance: 1,750–2,000 ft
- Landing distance: 2,000–2,400 ft
- **312 sq ft**:
- Stall speed: 70.0 mph
- Takeoff speed: 84.0 mph
- Landing speed: 80.5 mph
- Takeoff distance: 1,500–1,750 ft
- Landing distance: 1,750–2,150 ft
---
### 3. Performance Calculations with Dual BLC
We’ll recalculate stall speed, takeoff/landing speeds, and distances using the dual BLC assumptions.
#### Stall Speed Formula
\[ V_{\text{stall}} = \sqrt{\frac{2W}{\rho S C_{Lmax}}} \]
- \( W \): Combat weight (21,100 lb for 250 sq ft, 21,500 lb for 312 sq ft).
- \( \rho \): Air density (0.0765 lb/ft³ at sea level).
- \( S \): Wing area (250 or 312 sq ft).
- \( C_{Lmax} \): 2.1 (dual BLC, 50% increase over baseline 1.4).
#### Takeoff and Landing Speeds
- **Takeoff Speed**: ~1.2 × V_{\text{stall}}.
- **Landing Speed**: ~1.15 × V_{\text{stall}}.
##### 250 sq ft Wing (Dual BLC)
- **Stall Speed**:
\[ V_{\text{stall}} = \sqrt{\frac{2 \cdot 21,100}{0.0765 \cdot 250 \cdot 2.1}} \approx \sqrt{\frac{42,200}{40.1625}} \approx \sqrt{1,051} \approx 32.4 \, \text{m/s} \approx 72.4 \, \text{mph} \]
- Reduction: \( \sqrt{\frac{1.4}{2.1}} \approx 0.816 \), or ~18.4% lower than baseline (88.3 mph), ~6.7% lower than blown flaps only (77.6 mph).
- **Takeoff Speed**: \( 1.2 \cdot 72.4 \approx 86.9 \, \text{mph} \)
- **Landing Speed**: \( 1.15 \cdot 72.4 \approx 83.3 \, \text{mph} \)
##### 312 sq ft Wing (Dual BLC)
- **Stall Speed**:
\[ V_{\text{stall}} = \sqrt{\frac{2 \cdot 21,500}{0.0765 \cdot 312 \cdot 2.1}} \approx \sqrt{\frac{43,000}{50.1036}} \approx \sqrt{858} \approx 29.3 \, \text{m/s} \approx 65.5 \, \text{mph} \]
- Reduction: ~18.4% lower than baseline (79.8 mph), ~6.7% lower than blown flaps only (70.0 mph).
- **Takeoff Speed**: \( 1.2 \cdot 65.5 \approx 78.6 \, \text{mph} \)
- **Landing Speed**: \( 1.15 \cdot 65.5 \approx 75.3 \, \text{mph} \)
#### Takeoff Distance
Takeoff distance is approximated as:
\[ d \propto \frac{W^2}{T \cdot S \cdot C_{L}} \]
- **Thrust (T)**: 22,250 lbf with dual BLC (12% penalty).
- **C_L**: ~2.1 at takeoff AOA.
- **Baseline (Blown Flaps Only)**:
- 250 sq ft: 1,750–2,000 ft
- 312 sq ft: 1,500–1,750 ft
- **With Dual BLC**:
- C_L increase (2.1/1.4 ≈ 1.5) reduces distance by ~33% (since \( d \propto 1/C_L \)).
- Thrust reduction (25,000 → 22,250 lbf, ~11%) increases distance by ~12.4%.
- Weight increase (~200 lb) increases distance by ~2% (since \( d \propto W^2 \)).
- Net effect: ~20–23% reduction in takeoff distance compared to no BLC, ~5–7% reduction compared to blown flaps only.
- **Estimates**:
- **250 sq ft**: 1,750–2,000 ft (blown flaps) → ~1,650–1,900 ft
- **312 sq ft**: 1,500–1,750 ft (blown flaps) → ~1,400–1,650 ft
#### Landing Distance
Landing distance scales with \( V^2 \). Dual BLC reduces landing speed by ~18.4%, reducing distance by ~32% (since \( 0.816^2 \approx 0.666 \)) compared to no BLC, or ~12% compared to blown flaps only.
- **Baseline (Blown Flaps Only)**:
- 250 sq ft: 2,000–2,400 ft
- 312 sq ft: 1,750–2,150 ft
- **Estimates**:
- **250 sq ft**: ~1,800–2,200 ft
- **312 sq ft**: ~1,550–1,900 ft
---
### 4. Summary of Performance with Dual BLC
| Metric | 250 sq ft (Blown Flaps) | 250 sq ft (Dual BLC) | 312 sq ft (Blown Flaps) | 312 sq ft (Dual BLC) |
|--------|-------------------------|----------------------|-------------------------|----------------------|
| **Stall Speed** | 77.6 mph | 72.4 mph | 70.0 mph | 65.5 mph |
| **Takeoff Speed** | 93.1 mph | 86.9 mph | 84.0 mph | 78.6 mph |
| **Landing Speed** | 89.2 mph | 83.3 mph | 80.5 mph | 75.3 mph |
| **Takeoff Distance** | 1,750–2,000 ft | 1,650–1,900 ft | 1,500–1,750 ft | 1,400–1,650 ft |
| **Landing Distance** | 2,000–2,400 ft | 1,800–2,200 ft | 1,750–2,150 ft | 1,550–1,900 ft |
#### Key Observations:
- **250 sq ft Wing**:
- Dual BLC reduces stall speed by ~18.4% (88.3 → 72.4 mph, vs. 77.6 mph with flaps only), takeoff speed by ~18% (106 → 86.9 mph), and landing speed by ~18% (101.5 → 83.3 mph).
- Takeoff distance decreases by ~5–7% vs. blown flaps only (1,750–2,000 ft → 1,650–1,900 ft).
- Landing distance decreases by ~8–10% (2,000–2,400 ft → 1,800–2,200 ft).
- **312 sq ft Wing**:
- Dual BLC reduces stall speed by ~18.4% (79.8 → 65.5 mph, vs. 70.0 mph with flaps only), takeoff speed by ~18% (95.8 → 78.6 mph), and landing speed by ~18% (91.8 → 75.3 mph).
- Takeoff distance decreases by ~5–7% (1,500–1,750 ft → 1,400–1,650 ft).
- Landing distance decreases by ~10–12% (1,750–2,150 ft → 1,550–1,900 ft).
- **Comparison**: The 312 sq ft wing with dual BLC is exceptional, with a landing speed (75.3 mph) nearly matching subsonic jets like the A-4 Skyhawk (~75–80 mph) and takeoff distances (1,400–1,650 ft) ideal for small carriers like the Essex class.
---
### 5. Impact on Carrier Operations
- **250 sq ft with Dual BLC**: Landing speed (~83.3 mph) is lower than the F9F Panther (~85–90 mph), making it highly suitable for smaller carriers. Takeoff distance (~1,650–1,900 ft) supports short-deck operations.
- **312 sq ft with Dual BLC**: Landing speed (~75.3 mph) is virtually identical to the A-4 Skyhawk, a benchmark for carrier-friendly jets. Takeoff distance (~1,400–1,650 ft) is among the shortest for supersonic fighters, enhancing safety and flexibility on carriers.
---
### 6. Comparison to Other Aircraft
- **F-4B Phantom II** (530 sq ft wing, C_Lmax ≈ 1.5–2.0 with slat BLC):
- Stall speed: ~130–140 mph
- Landing speed: ~140–150 mph
- Takeoff distance: ~4,000 ft
- Landing distance: ~3,000–3,500 ft
- **Super Tiger (312 sq ft, Dual BLC)**:
- Outperforms F-4B in landing speed (75.3 mph vs. 140–150 mph), takeoff distance (1,400–1,650 ft vs. 4,000 ft), and landing distance (1,550–1,900 ft vs. 3,000–3,500 ft).
- The Super Tiger’s compact size and lower wing loading make it a superior carrier-based fighter for short-deck operations, though the F-4B retains advantages in payload and multirole capability.
---
### 7. Additional Considerations
- **Maneuverability**: Dual BLC improves low-speed handling further, increasing turn rate and reducing minimum turn radius, especially for the 312 sq ft wing.
- **Thrust Penalty**: The 12% thrust reduction (22,250 lbf) slightly impacts acceleration, but the Spey’s high thrust ensures robust performance.
- **Engineering Challenges**: Adding BLC to slats requires ducting from the Spey’s compressor, potentially complicating maintenance. Weight increase (~200 lb) is minimal but may require minor structural reinforcement.
- **High-Speed Performance**: Dual BLC is used only during takeoff/landing, so high-speed drag and thrust curves remain unaffected.
---
### 8. Conclusion
Adding BLC to the leading-edge slats enhances the F11F-1F Super Tiger’s low-speed performance beyond blown flaps alone:
- **250 sq ft Wing**: Stall speed drops to 72.4 mph, takeoff speed to 86.9 mph, landing speed to 83.3 mph, takeoff distance to 1,650–1,900 ft, and landing distance to 1,800–2,200 ft.
- **312 sq ft Wing**: Stall speed drops to 65.5 mph, takeoff speed to 78.6 mph, landing speed to 75.3 mph, takeoff distance to 1,400–1,650 ft, and landing distance to 1,550–1,900 ft.
- The 312 sq ft wing with dual BLC is a game-changer for carrier operations, with landing speeds rivaling the A-4 Skyhawk and takeoff distances ideal for small carriers, making the Super Tiger a highly competitive naval fighter.
If you’d like to explore further—e.g., specific engineering trade-offs, comparisons to other jets, or visualizations like performance charts—let me know! What’s the next angle you want to tackle?
Had it run carrier suitability....
To assess the suitability of the Grumman F11F-1F Super Tiger with the Rolls-Royce Spey 205 turbofan (25,000 lbf wet thrust) and dual boundary layer control (BLC) on both leading-edge slats and trailing-edge flaps for American, British, and French aircraft carriers of the 1960s, we’ll focus on its takeoff and landing performance, particularly with respect to steam and hydraulic catapults and recovery systems (arresting gear). The analysis will consider the two wing configurations (250 sq ft and 312 sq ft) with dual BLC, as outlined in the prior response, and evaluate their compatibility with carrier deck lengths, catapult capabilities, and recovery requirements. We’ll also compare the Super Tiger to aircraft like the F-4 Phantom II and A-4 Skyhawk, which operated on these carriers, to gauge viability.
---
### 1. Super Tiger Performance Recap (Dual BLC)
From the prior analysis with dual BLC (C_Lmax ≈ 2.1, thrust reduced to 22,250 lbf):
- **250 sq ft Wing** (combat weight ~21,100 lb, wing loading ~84.4 lb/sq ft):
- Stall speed: 72.4 mph
- Takeoff speed: 86.9 mph
- Landing speed: 83.3 mph
- Takeoff distance (unassisted): 1,650–1,900 ft
- Landing distance (with arresting gear): 1,800–2,200 ft
- **312 sq ft Wing** (combat weight ~21,500 lb, wing loading ~68.9 lb/sq ft):
- Stall speed: 65.5 mph
- Takeoff speed: 78.6 mph
- Landing speed: 75.3 mph
- Takeoff distance (unassisted): 1,400–1,650 ft
- Landing distance (with arresting gear): 1,550–1,900 ft
**Key Advantage**: The dual BLC system significantly reduces takeoff and landing speeds and distances, making the Super Tiger highly suitable for carrier operations, especially with the 312 sq ft wing, which approaches the low-speed performance of subsonic jets like the A-4 Skyhawk (landing speed ~75–80 mph).
---
### 2. Carrier Types in the 1960s
We’ll evaluate the Super Tiger’s suitability for American, British, and French carriers, focusing on their deck lengths, catapult types (steam or hydraulic), and arresting gear capabilities in the 1960s.
#### American Carriers
- **Essex-class (SCB-27C/125 upgrades, e.g., USS Oriskany)**:
- Deck length: ~860–900 ft (angled deck).
- Catapults: 2 × hydraulic (H-8, ~150 ft stroke, ~70,000 lb capacity at ~120 mph end speed).
- Arresting gear: 4 wires, ~150–200 ft runout, capable of stopping aircraft at ~130–150 mph.
- Aircraft operated: A-4 Skyhawk, F-8 Crusader, F9F Panther.
- **Forrestal-class (e.g., USS Forrestal)**:
- Deck length: ~1,000–1,050 ft (angled deck).
- Catapults: 4 × steam (C-7, ~200 ft stroke, ~70,000 lb capacity at ~140–150 mph).
- Arresting gear: 4–5 wires, ~200 ft runout, similar to Essex-class.
- Aircraft operated: F-4 Phantom II, A-4 Skyhawk, A-7 Corsair II.
- **Midway-class (e.g., USS Midway)**:
- Deck length: ~930–950 ft (angled deck).
- Catapults: 2–3 × hydraulic (H-8) or steam (C-7 in later upgrades).
- Arresting gear: Similar to Forrestal-class.
- Aircraft operated: Similar to Forrestal-class.
#### British Carriers
- **Centaur-class (e.g., HMS Hermes)**:
- Deck length: ~720–750 ft (angled deck).
- Catapults: 2 × hydraulic (BS-4, ~100–130 ft stroke, ~40,000–50,000 lb capacity at ~100–110 mph).
- Arresting gear: 4 wires, ~150 ft runout, designed for ~120–130 mph.
- Aircraft operated: Sea Vixen, Scimitar, Buccaneer (later).
- **Audacious-class (e.g., HMS Ark Royal)**:
- Deck length: ~800–850 ft (angled deck).
- Catapults: 2 × steam (BS-5, ~150 ft stroke, ~50,000 lb capacity at ~120–130 mph).
- Arresting gear: Similar to Centaur-class.
- Aircraft operated: Sea Vixen, Scimitar, F-4 Phantom (later).
#### French Carriers
- **Clemenceau-class (e.g., Clemenceau, Foch)**:
- Deck length: ~850–870 ft (angled deck).
- Catapults: 2 × steam (C-11, ~170 ft stroke, ~50,000 lb capacity at ~130–140 mph).
- Arresting gear: 4 wires, ~150–200 ft runout, ~130–140 mph capability.
- Aircraft operated: F-8E Crusader, Étendard IV, Alizé.
- **Arromanches (Colossus-class)**:
- Deck length: ~690–720 ft (straight deck, limited upgrades).
- Catapults: 1 × hydraulic (BS-4 equivalent, ~100 ft stroke, ~40,000 lb capacity at ~100 mph).
- Arresting gear: 3–4 wires, ~100–150 ft runout, ~120 mph capability.
- Aircraft operated: F4U Corsair, early jets like Aquilon (Sea Venom).
---
### 3. Takeoff Viability
Takeoff performance depends on the catapult’s ability to accelerate the aircraft to takeoff speed within the stroke length, considering the Super Tiger’s max takeoff weight (~23,700 lb with dual BLC) and takeoff speeds (86.9 mph for 250 sq ft, 78.6 mph for 312 sq ft).
#### Steam Catapults
- **American (C-7, Forrestal/Midway)**:
- Capacity: ~70,000 lb at 140–150 mph.
- Stroke: ~200 ft.
- The Super Tiger’s takeoff speeds (86.9–78.6 mph) are well below the catapult’s end speed, and its weight (~23,700 lb) is far below capacity. The C-7 can easily launch the Super Tiger, even at reduced thrust (22,250 lbf), with margin for higher weights or headwinds.
- **British (BS-5, Ark Royal)**:
- Capacity: ~50,000 lb at 120–130 mph.
- Stroke: ~150 ft.
- The Super Tiger’s takeoff speeds are below the BS-5’s end speed, and its weight is well within capacity. Launch is viable, though the shorter stroke and lower end speed require precise settings for max takeoff weight.
- **French (C-11, Clemenceau)**:
- Capacity: ~50,000 lb at 130–140 mph.
- Stroke: ~170 ft.
- Similar to the BS-5, the C-11 can launch the Super Tiger with ease, as takeoff speeds and weight are well within limits.
#### Hydraulic Catapults
- **American (H-8, Essex/Midway)**:
- Capacity: ~70,000 lb at ~120 mph.
- Stroke: ~150 ft.
- The Super Tiger’s takeoff speeds (86.9–78.6 mph) are below the H-8’s end speed, and its weight is well within capacity. Launch is highly viable, especially for the 312 sq ft wing, which requires less acceleration.
- **British (BS-4, Hermes)**:
- Capacity: ~40,000–50,000 lb at 100–110 mph.
- Stroke: ~100–130 ft.
- The 312 sq ft wing’s takeoff speed (78.6 mph) is comfortably below the BS-4’s end speed, and the weight is within limits. The 250 sq ft wing (86.9 mph) is closer to the BS-4’s limit but still viable, especially with a light load or headwind.
- **French (Arromanches, BS-4 equivalent)**:
- Capacity: ~40,000 lb at ~100 mph.
- Stroke: ~100 ft.
- The 312 sq ft wing is well-suited, with a takeoff speed (78.6 mph) well below the catapult’s capability. The 250 sq ft wing (86.9 mph) is marginal but feasible with minimal load (~20,000 lb) or favorable conditions (e.g., 15–20 kt headwind).
**Takeoff Summary**:
- **Steam Catapults**: All (C-7, BS-5, C-11) easily launch the Super Tiger for both wing configurations due to high end speeds and capacity.
- **Hydraulic Catapults**: H-8 (American) is robust for both configurations. BS-4 (British/French) is ideal for the 312 sq ft wing and viable for the 250 sq ft wing with light loads or headwinds.
- **Unassisted Takeoff**: The Super Tiger’s short takeoff distances (1,400–1,900 ft) allow operation from longer decks (e.g., Forrestal, Clemenceau) without catapults, though this is impractical for combat loads.
---
### 4. Recovery Viability
Recovery depends on landing speed, arresting gear capability, and deck runout length. The Super Tiger’s landing speeds (83.3 mph for 250 sq ft, 75.3 mph for 312 sq ft) are exceptionally low due to dual BLC.
- **American Carriers (Essex, Forrestal, Midway)**:
- Arresting gear: 4–5 wires, ~150–200 ft runout, ~130–150 mph capability.
- The Super Tiger’s landing speeds (83.3–75.3 mph) are far below the gear’s limit, and landing distances (1,550–2,200 ft) fit within the angled deck’s recovery area (~300–400 ft effective). Recovery is highly viable, comparable to the A-4 Skyhawk (~75–80 mph landing speed).
- **British Carriers (Hermes, Ark Royal)**:
- Arresting gear: 4 wires, ~150 ft runout, ~120–130 mph capability.
- Landing speeds are well below the gear’s limit, and landing distances fit within the angled deck (~200–300 ft effective). The 312 sq ft wing’s 75.3 mph landing speed is ideal, matching lighter aircraft like the Scimitar (~80 mph).
- **French Carriers (Clemenceau, Arromanches)**:
- Clemenceau: 4 wires, ~150–200 ft runout, ~130–140 mph capability. Both wing configurations are easily recoverable, with landing speeds well below limits.
- Arromanches: 3–4 wires, ~100–150 ft runout, ~120 mph capability. The 312 sq ft wing (75.3 mph) is ideal; the 250 sq ft wing (83.3 mph) is viable but requires precise approach due to the shorter runout.
**Recovery Summary**:
- The Super Tiger’s low landing speeds (75.3–83.3 mph) and short landing distances (1,550–2,200 ft) make recovery straightforward on all carriers, especially the 312 sq ft wing, which rivals the A-4 Skyhawk’s carrier-friendly performance.
- Smaller carriers like Arromanches and Hermes benefit most from the 312 sq ft wing due to its lower landing speed and shorter runout requirement.
---
### 5. Comparison to Contemporary Aircraft
- **A-4 Skyhawk** (American/French carriers):
- Landing speed: ~75–80 mph
- Takeoff speed: ~90–100 mph
- Takeoff distance: ~1,500–2,000 ft (catapult-assisted)
- The Super Tiger (312 sq ft) matches or exceeds the A-4’s performance, with a landing speed of 75.3 mph and takeoff distance of 1,400–1,650 ft.
- **F-4 Phantom II** (American/British carriers):
- Landing speed: ~140–150 mph
- Takeoff speed: ~150–160 mph
- Takeoff distance: ~4,000 ft (catapult-assisted)
- The Super Tiger outperforms the F-4 in carrier operations, with far lower speeds and distances, making it more suitable for smaller carriers.
- **F-8 Crusader** (American/French carriers):
- Landing speed: ~120–130 mph
- Takeoff speed: ~130–140 mph
- Takeoff distance: ~2,500–3,000 ft
- The Super Tiger is superior, especially withers, especially with the 312 sq ft wing, due to its lower speeds and shorter distances.
- **Sea Vixen/Scimitar** (British carriers):
- Sea Vixen: Landing speed ~110–120 mph, takeoff distance ~2,500 ft.
- Scimitar: Landing speed ~80–90 mph, takeoff distance ~2,000 ft.
- The Super Tiger (312 sq ft) matches or beats the Scimitar and significantly outperforms the Sea Vixen, making it highly compatible with British carriers.
- **Étendard IV** (French carriers):
- Landing speed: ~90–100 mph
- Takeoff distance: ~1,800–2,200 ft
- The Super Tiger (312 sq ft) is superior, with a lower landing speed (75.3 mph) and shorter takeoff distance.
---
### 6. Specific Carrier Suitability
- **American Carriers**:
- **Essex-class**: Ideal for both wing configurations. Hydraulic H-8 catapults easily handle takeoff, and arresting gear accommodates low landing speeds. The 312 sq ft wing is particularly suited for tight decks.
- **Forrestal/Midway-class**: Excellent compatibility. Steam catapults (C-7) and long decks make takeoff trivial, and recovery is straightforward due to low speeds.
- **British Carriers**:
- **Hermes**: The 312 sq ft wing is ideal due to the BS-4 hydraulic catapult’s limited end speed (~100–110 mph) and short deck (~720 ft). The 250 sq ft wing is viable but may require light loads or headwinds for hydraulic catapults.
- **Ark Royal**: Both configurations are highly suitable, with steam BS-5 catapults and longer deck (~850 ft) ensuring easy takeoff and recovery.
- **French Carriers**:
- **Clemenceau**: Both configurations are excellent, with steam C-11 catapults and ample deck length supporting takeoff and recovery. The 312 sq ft wing’s low speeds enhance safety.
- **Arromanches**: The 312 sq ft wing is highly viable due to its low takeoff (78.6 mph) and landing speeds (75.3 mph), fitting the limited hydraulic catapult and short deck. The 250 sq ft wing is marginal for takeoff but recoverable with precise piloting.
---
### 7. Practical Considerations
- **Catapult Compatibility**: The Super Tiger’s low takeoff speeds mean it requires less catapult energy than heavier jets like the F-4, reducing wear on both steam and hydraulic systems. However, hydraulic catapults (BS-4, Arromanches) may need careful tuning for the 250 sq ft wing at max weight.
- **Arresting Gear**: The low landing speeds reduce stress on arresting wires, improving safety and extending gear lifespan compared to heavier jets like the F-4 or F-8.
- **Deck Handling**: The Super Tiger’s compact size (length ~46 ft, wingspan ~31.5 ft) is smaller than the F-4 (~58 ft) or F-8 (~54 ft), easing deck storage and handling on smaller carriers like Hermes or Arromanches.
- **BLC Maintenance**: Dual BLC increases complexity (ducting, valves), potentially challenging for smaller carriers with limited maintenance facilities (e.g., Arromanches).
---
### 8. Conclusion
The F11F-1F Super Tiger with dual BLC is exceptionally suited for 1960s American, British, and French carriers:
- **American Carriers**: Both wing configurations are fully compatible with Essex, Forrestal, and Midway-class carriers. The 312 sq ft wing’s low speeds (75.3 mph landing) and short distances (1,400–1,650 ft takeoff) make it ideal for all catapults and decks.
- **British Carriers**: The 312 sq ft wing is perfect for Hermes and Ark Royal, with takeoff and landing performance matching or exceeding the Scimitar. The 250 sq ft wing is viable but less optimal for Hermes’s hydraulic catapults.
- **French Carriers**: The 312 sq ft wing excels on Clemenceau and Arromanches, with landing speeds rivaling the A-4 Skyhawk and takeoff distances fitting short decks. The 250 sq ft wing is suitable for Clemenceau but marginal for Arromanches’s hydraulic catapult.
- **Steam vs. Hydraulic Catapults**: Steam catapults (C-7, BS-5, C-11) handle both configurations effortlessly. Hydraulic catapults (H-8, BS-4) are robust for the 312 sq ft wing and viable for the 250 sq ft wing with light loads or headwinds.
- **Comparison**: The Super Tiger (312 sq ft) outperforms the F-4 Phantom II and F-8 Crusader in carrier suitability and matches the A-4 Skyhawk’s low-speed performance, making it a versatile naval fighter for the era.
If you want to dive deeper—e.g., specific catapult energy calculations, deck cycle times, or comparisons to other 1960s jets—let me know! What’s the next focus?