Not much beyond that. The US had several AESA's in the pipeline around that time. These were in production systems but their official in-service date was tied to aircraft milestones and not their own maturity. I believe the first F-22 fitted with the APG-77 flew around the same time as the F-15's did with their AESA's.
I actually did some digging and antidotally I found APG-63(v)2 is much heavier then any other member of its family, like 400kg. It requires significant weight be added to the back for balance. The software was tailored for finding cruise missiles and normal modes found on other versions of apg-63 weren’t added till around 2005. They would be paired with a normal F-15 for cruise missile hunting. Looking for something official looking that says that now.
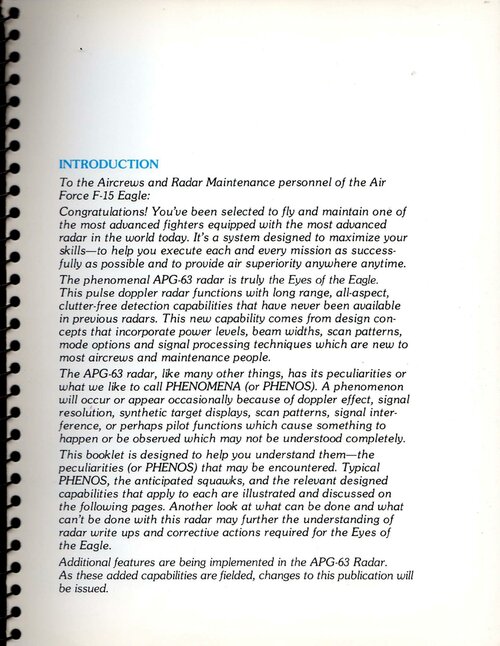
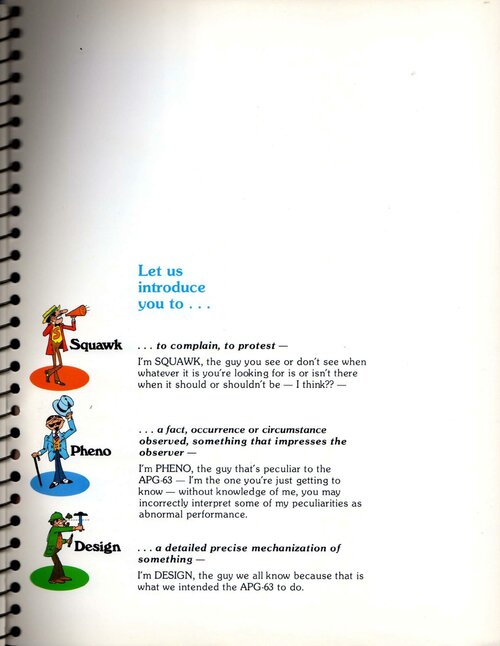
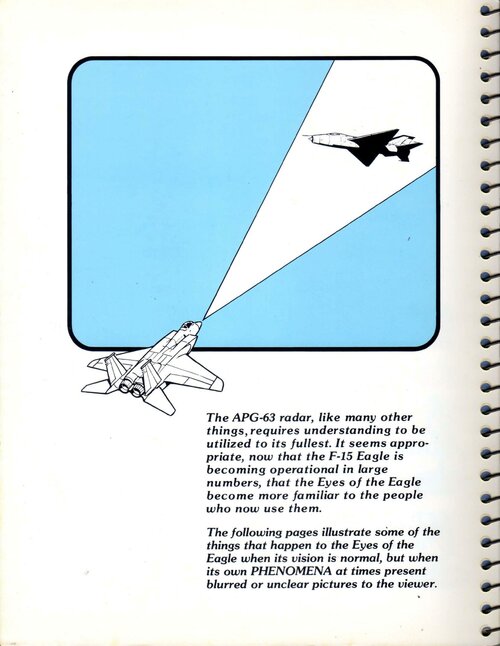
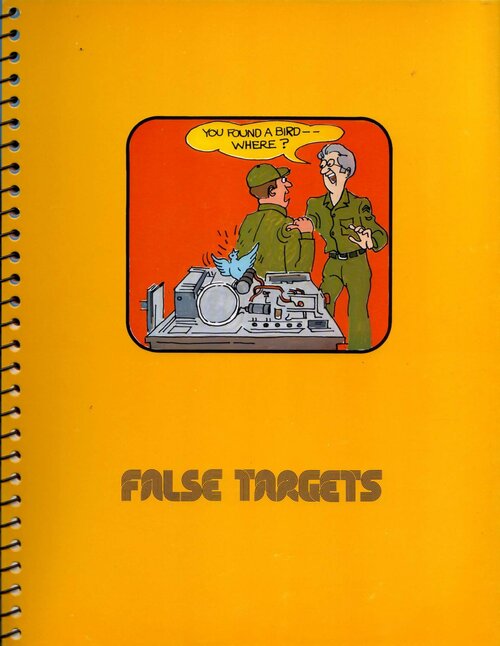
Hughes AN/APG-63 publication "The Phenomenal APG-63" aka "why aircrew complaints about this radar are bogus". First 10 pages attached, document is 50 pages long.
head-on detection range as tested on the original 70's APG-63 was 85nm vs. a 6m^2 target (T-33 in case you're wondering, it has that approximate head on RCS).
Do you have this chart? I remember seeing it a while ago but I can"t seem to find it anymore. Had several ranges of detection for the T33s in HPRF and MPRF
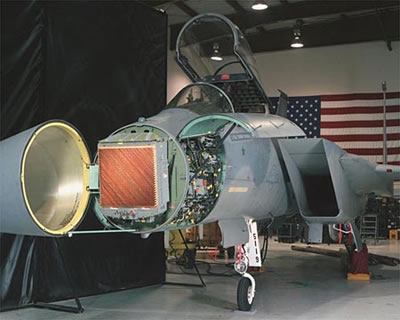
I've been looking on the net for some APG-63(V)2 pictures, surprisingly theres only one repeated everyhere , and even more surprisinly , maby its just a light trick , but does the AESA antenna in thst pics seems to be covered whit something ? i meen like a plastic cover of some sort ? the T/R modules appears to be aranged diagonally , but i'm not sure ...are there any clearer pics of the thing out there ?
Still looking for more info on (v)2 it’s still a huge mystery. It appears to have come from a classified program. It definitely predates apg-63(v)1 which already had provisions for (v)3. It suspect it might have used the TR modules from the original apg-77 but the manufacturer is Raytheon which wouldn’t make sense. All other American AESA radars are somehow related. With apg-77 informing apg-80, apg-81, and apg-83. Apg-79 is related to apg-63(v)3 apg-82 and apg-84. But (v)2 while informing others seems to have no relation hardware wise. It’s very strange.
Nothing mysterious about it at all. It was all out in the open when it came out. 18 F-15s were equipped as I recall. It was so heavy 600 pounds of ballast had to be added to the rear of the aircraft.
Is there info regarding the detection performance about the APG-63 besides the 1974 T-33 detection chart?
I can't find it but using the IEEE APG 66 Performance document( apg66 range values) and the APG63 Case Study( apg66 and apg63 ratio), I get a range( HPRF) of 77 Nm for a 1.3m^2 target or 80 Nm for a 2m^2 target(depending on the apg66 value I use), a ~7% difference between them.. This should be for an early 80s PSP APG-63.
With MPRF I have nothing.
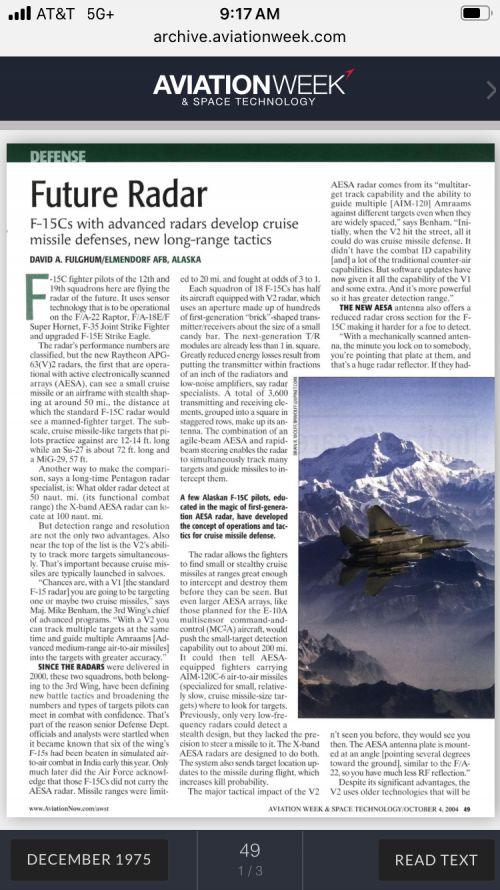
(6) The radar has a demonstrated detection range of more than 100 nautical miles (161km) against small sized targets
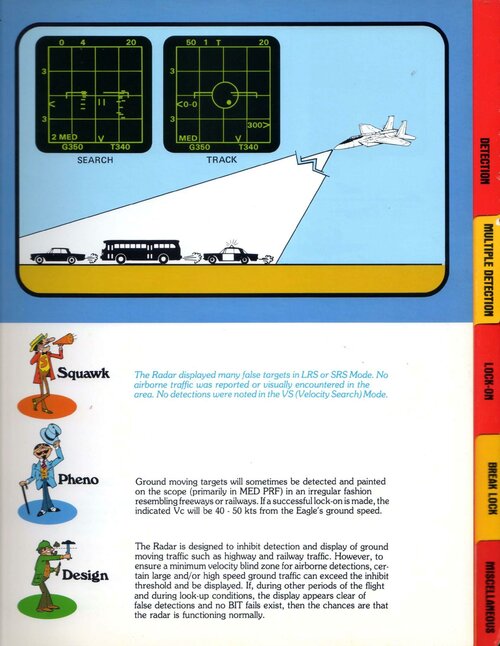
FRAME STORE PUSH TO ERASE (0, 1, 2, 3, 0, 1, 2, 3)...no IDEA...maybe a sort of "memory of traces", sort of blip appears at here then at here, and then here (*---*---*) and this options allow you to see those radar blips sucessions?...any idea?
Is there info regarding the detection performance about the APG-63 besides the 1974 T-33 detection chart?
I can't find it but using the IEEE APG 66 Performance document( apg66 range values) and the APG63 Case Study( apg66 and apg63 ratio), I get a range( HPRF) of 77 Nm for a 1.3m^2 target or 80 Nm for a 2m^2 target(depending on the apg66 value I use), a ~7% difference between them.. This should be for an early 80s PSP APG-63.
With MPRF I have nothing.
You can calculate the range by yourself. There's 20 head-on targets on the graph.
Pd85= 0.85 chance be detected. A rough method is to bar 3 targets on that graph and find the closest range.
(20*0.85=17, 20-17=3, All detected= 100% chance, 17 detected= 85% chance)
The range is about 45-50NMI.
Is there info regarding the detection performance about the APG-63 besides the 1974 T-33 detection chart?
I can't find it but using the IEEE APG 66 Performance document( apg66 range values) and the APG63 Case Study( apg66 and apg63 ratio), I get a range( HPRF) of 77 Nm for a 1.3m^2 target or 80 Nm for a 2m^2 target(depending on the apg66 value I use), a ~7% difference between them.. This should be for an early 80s PSP APG-63.
With MPRF I have nothing.
BTW your images are front different materials. The second chart is from the 'APG-66 Performance', it claimed a 20-23NMI detection range for 1.3sqm target.
23.000*((5/1.3)^(1/4))= 32.210NMI
The (maximum, thus, head-on, some proper scanning mode) detection range for APG-66 against a 'conventional' 5sqm target is supposed to be about 30NMI.
The third one is a theoretical calculation. The data is contradictory to the calculation I made above- rather the F-16 one being too short or F-15 one being too long.
Dunno why you take 5m². T-33's RCS is lower, I set it at 2m².
"ANALYTIC RADAR TARGET MODELING"(R. Mittra, et al, December 1972) and "T-33 Radar Cross Section Measurements and Scintillation Analysis,"(W.A. Pierson and R.W. Clay, February 1972), the frontal cross section of the T-33 front aspect at 8.8GHz(Xband)was theorized at 2 dBms(2.23m^2) and experimentally 0 dBsm(1m^2)(Though the experimental model was a half size model and 6dBsm were added to adjust)
You can calculate the range by yourself. There's 20 head-on targets on the graph.
Pd85= 0.85 chance be detected. A rough method is to bar 3 targets on that graph and find the closest range.
(20*0.85=17, 20-17=3, All detected= 100% chance, 17 detected= 85% chance)
The range is about 45-50NMI.
I'll use this method. I tried to get the values accurate as possible, ±0.1 NM.
I get a slightly higher R85
the detection ranges chart of T-33s as targets is from 1974 latest. Meanwhile the Casestudy is from 1983. In this timeframe the apg-63 went through several upgrades of all kinds, from software to hardware. One that is not mentioned alot is that in 1978(before PSP) the parametric amplifiers got replaced by FET amps, and ~20% range increase. Thus you'll see 1.2x to reflect it and baseline for the original values.
On baseline, the 20NM detection seems to be closely to an outlier. It's really close to being highly unlikely through standard deviation, close to 3 when being included in the values but way off when I only take the furthest 19 targets, more than 3 StDs when only taking the 19.
Below without it.
R85 with 1.2x, 54NM
R85 with 1.2x removing outlier, 56NM.
Both things, the Apg 66 and the 1974 APG63 chart, are not generalized. Meaning they are not under the same conditions and modes so a fully direct comparison can't be justly made but we can take a general idea. We know the conditions for the Apg 66 but not for the Apg63.
The 1974 detection range chart doesn't mention closure rate, scan pattern( azimuth and bars) meanwhile the Case study chart is generalized for scan pattern but no closure rate info nor specific target size. With a high closure rate, the Pd curve will be slacker and at a shorter range compared to a low closure rate.
APG 66 info (on flight test) tells use they used a 2bar ±30° scan pattern meanwhile on the case study chart it's done with a 2bar ±60° scan pattern. That's twice the scan time which "lowers" the ranges on the Pd chart.
Even the start range affects Pd charts. APG-66 gives start ranges meanwhile nothing on the other 2.
One thing is for sure, the case study chart is generalized.
Quite a hell of a radar either way, R50 ~61.5NM(126km) for a 3m² target in the 1974, ~73.8NM post 1978. SU27 at R50 is 80-100km a decade later.
Pd curves for those T-33s, red line in the 1974 test without the 20NM outlier and black is 1.2x 1974 test.
However one thing that keeps thinking is the maximum instrumented ranging. On the 1981 -34, the maximum ranging is 86NM and it is backed up by the PSP document that shows the maximum number of range bins for HPRF is 48bins for 100 mile which is ~86 NM. Why so little? Did it get increase later on? I think it did, for example on the apg 65( by 2000) the limit was 99NM.
Dunno why you take 5m². T-33's RCS is lower, I set it at 2m².
"ANALYTIC RADAR TARGET MODELING"(R. Mittra, et al, December 1972) and "T-33 Radar Cross Section Measurements and Scintillation Analysis,"(W.A. Pierson and R.W. Clay, February 1972), the frontal cross section of the T-33 front aspect at 8.8GHz(Xband)was theorized at 2 dBms(2.23m^2) and experimentally 0 dBsm(1m^2)(Though the experimental model was a half size model and 6dBsm were added to adjust)
I'll use this method. I tried to get the values accurate as possible, ±0.1 NM.
I get a slightly higher R85
the detection ranges chart of T-33s as targets is from 1974 latest. Meanwhile the Casestudy is from 1983. In this timeframe the apg-63 went through several upgrades of all kinds, from software to hardware. One that is not mentioned alot is that in 1978(before PSP) the parametric amplifiers got replaced by FET amps, and ~20% range increase. Thus you'll see 1.2x to reflect it and baseline for the original values. View attachment 784158
On baseline, the 20NM detection seems to be closely to an outlier. It's really close to being highly unlikely through standard deviation, close to 3 when being included in the values but way off when I only take the furthest 19 targets, more than 3 StDs when only taking the 19.
Below without it.
R85 with 1.2x, 54NM
R85 with 1.2x removing outlier, 56NM.
Both things, the Apg 66 and the 1974 APG63 chart, are not generalized. Meaning they are not under the same conditions and modes so a fully direct comparison can't be justly made but we can take a general idea. We know the conditions for the Apg 66 but not for the Apg63.
The 1974 detection range chart doesn't mention closure rate, scan pattern( azimuth and bars) meanwhile the Case study chart is generalized for scan pattern but no closure rate info nor specific target size. With a high closure rate, the Pd curve will be slacker and at a shorter range compared to a low closure rate.
APG 66 info (on flight test) tells use they used a 2bar ±30° scan pattern meanwhile on the case study chart it's done with a 2bar ±60° scan pattern. That's twice the scan time which "lowers" the ranges on the Pd chart.
Even the start range affects Pd charts. APG-66 gives start ranges meanwhile nothing on the other 2.
One thing is for sure, the case study chart is generalized.
Quite a hell of a radar either way, R50 ~61.5NM(126km) for a 3m² target in the 1974, ~73.8NM post 1978. SU27 at R50 is 80-100km a decade later.
However one thing that keeps thinking is the maximum instrumented ranging. On the 1981 -34, the maximum ranging is 86NM and it is backed up by the PSP document that shows the maximum number of range bins for HPRF is 48bins for 100 mile which is ~86 NM. Why so little? Did it get increase later on? I think it did, for example on the apg 65( by 2000) the limit was 99NM.
Yes, for an Cum85 method, the scanning pattern makes difference. But, we still assume that the Pd50/Cum85 in different modes give almost-same figures, otherwise, everything will be complicated; besides, it should be almost-same in practice.
Dunno why you take 5m². T-33's RCS is lower, I set it at 2m².
"ANALYTIC RADAR TARGET MODELING"(R. Mittra, et al, December 1972) and "T-33 Radar Cross Section Measurements and Scintillation Analysis,"(W.A. Pierson and R.W. Clay, February 1972), the frontal cross section of the T-33 front aspect at 8.8GHz(Xband)was theorized at 2 dBms(2.23m^2) and experimentally 0 dBsm(1m^2)(Though the experimental model was a half size model and 6dBsm were added to adjust)
I'll use this method. I tried to get the values accurate as possible, ±0.1 NM.
I get a slightly higher R85
the detection ranges chart of T-33s as targets is from 1974 latest. Meanwhile the Casestudy is from 1983. In this timeframe the apg-63 went through several upgrades of all kinds, from software to hardware. One that is not mentioned alot is that in 1978(before PSP) the parametric amplifiers got replaced by FET amps, and ~20% range increase. Thus you'll see 1.2x to reflect it and baseline for the original values. View attachment 784158
On baseline, the 20NM detection seems to be closely to an outlier. It's really close to being highly unlikely through standard deviation, close to 3 when being included in the values but way off when I only take the furthest 19 targets, more than 3 StDs when only taking the 19.
Below without it.
R85 with 1.2x, 54NM
R85 with 1.2x removing outlier, 56NM.
Both things, the Apg 66 and the 1974 APG63 chart, are not generalized. Meaning they are not under the same conditions and modes so a fully direct comparison can't be justly made but we can take a general idea. We know the conditions for the Apg 66 but not for the Apg63.
The 1974 detection range chart doesn't mention closure rate, scan pattern( azimuth and bars) meanwhile the Case study chart is generalized for scan pattern but no closure rate info nor specific target size. With a high closure rate, the Pd curve will be slacker and at a shorter range compared to a low closure rate.
APG 66 info (on flight test) tells use they used a 2bar ±30° scan pattern meanwhile on the case study chart it's done with a 2bar ±60° scan pattern. That's twice the scan time which "lowers" the ranges on the Pd chart.
Even the start range affects Pd charts. APG-66 gives start ranges meanwhile nothing on the other 2.
One thing is for sure, the case study chart is generalized.
Quite a hell of a radar either way, R50 ~61.5NM(126km) for a 3m² target in the 1974, ~73.8NM post 1978. SU27 at R50 is 80-100km a decade later.
However one thing that keeps thinking is the maximum instrumented ranging. On the 1981 -34, the maximum ranging is 86NM and it is backed up by the PSP document that shows the maximum number of range bins for HPRF is 48bins for 100 mile which is ~86 NM. Why so little? Did it get increase later on? I think it did, for example on the apg 65( by 2000) the limit was 99NM.
BTW, you know, if you gonna change instrumented range(i.e. range gate), you are gonna change the signal pattern(e.g. PRF, CPI etc.), then change the filters (since your PRF is changed). A lot of redesign must be made.
Of course, the instrumented range should be determined by large targets, because you need to hit them. Thus, this does not effect small and middle ones.
Can't say much about it, dunno where that comes from. Signal polarization isn't given, same with the frequency. Things vary. The one I gave give those details, same polariazation and a close frequency which shouldn't give much variation.
On Concepts for Improvement of Airport Surveillance, a full sized T-33 at vertical polarization at 2.9GHz shows an mean RCS values of under 1dBsm ± 10° from the nose....
BTW, you know, if you gonna change instrumented range(i.e. range gate), you are gonna change the signal pattern(e.g. PRF, CPI etc.), then change the filters (since your PRF is changed). A lot of redesign must be made.
I don't think PRF must really be changed, but the time of each phase during the FM and the bandwidth to allow a longer range, but thats just theoretical. Dunno what other software/hardware limitation they had.
Of course, the instrumented range should be determined by large targets, because you need to hit them. Thus, this does not effect small and middle ones.
Can't say much about it, dunno where that comes from. Signal polarization isn't given, same with the frequency. Things vary. The one I gave give those details, same polariazation and a close frequency which shouldn't give much variation.
On Concepts for Improvement of Airport Surveillance, a full sized T-33 at vertical polarization at 2.9GHz shows an mean RCS values of under 1dBsm ± 10° from the nose....
I don't think PRF must really be changed, but the time of each phase during the FM and the bandwidth to allow a longer range, but thats just theoretical. Dunno what other software/hardware limitation they had.
Could be, just from doctrine as it's not its job. But then what is the point of having a 160NM scope display if only 53% is usable.
If you increase the sampling range(5°->10°), you will get a similar envelop. If you Divide it into 4 areas (front, back, side), it will be more 'average'.
2. Um, when you 'send' a pulse out, your duplexer must be switched to 'receiving' and wait until you think there's no need to 'wait'. Then you switch to 'transmitting' and send another pulse. The 'waiting time' is determined by the wave returning time, related to your distance to the target.
Thus, if you designate a useful range, you will designate the 'waiting time' - the Pulse Repetition Interval. And the Pulse Repetition Frequency. If this range is too short, PRI too small, PRF too high, the returning wave will return in interval belonging to another pulse, thus, range ambiguity. Like this:
Pulse2---Return1-----Pulse2---Return3-----Pulse4...
So the instrumented maximum range, thus, the maximum useful range does matter, for range gate, for filters, etc.
(For later radars like APG-70, they use multiple, actually 3, HPRFs to solve the actual range. And many changes was made to upgrade APG-63 to APG-70. It came out to be a new radar.)
3.Because the radar does not only hit small air-to-air targets. They do a lot of things, such as hitting enemy bombers, EW&ELINT units, large aircraft, etc., which do needs a larger range.
If you increase the sampling range(5°->10°), you will get a similar envelop. If you Divide it into 4 areas (front, back, side), it will be more 'average
2. Um, when you 'send' a pulse out, your duplexer must be switched to 'receiving' and wait until you think there's no need to 'wait'. Then you switch to 'transmitting' and send another pulse. The 'waiting time' is determined by the wave returning time, related to your distance to the target.
Thus, if you designate a useful range, you will designate the 'waiting time' - the Pulse Repetition Interval. And the Pulse Repetition Frequency. If this range is too short, PRI too small, PRF too high, the returning wave will return in interval belonging to another pulse, thus, range ambiguity. Like this:
Pulse2---Return1-----Pulse2---Return3-----Pulse4...
So the instrumented maximum range, thus, the maximum useful range does matter, for range gate, for filters, etc.
This applies for LPRF modes, not for the HPRF which the apg63 used. Read up the PSP document and the -34. It only used 2 PRFs to solve range, the other one was to detect the doppler return
Dunno why you take 5m². T-33's RCS is lower, I set it at 2m².
"ANALYTIC RADAR TARGET MODELING"(R. Mittra, et al, December 1972) and "T-33 Radar Cross Section Measurements and Scintillation Analysis,"(W.A. Pierson and R.W. Clay, February 1972), the frontal cross section of the T-33 front aspect at 8.8GHz(Xband)was theorized at 2 dBms(2.23m^2) and experimentally 0 dBsm(1m^2)(Though the experimental model was a half size model and 6dBsm were added to adjust)
I'll use this method. I tried to get the values accurate as possible, ±0.1 NM.
I get a slightly higher R85
the detection ranges chart of T-33s as targets is from 1974 latest. Meanwhile the Casestudy is from 1983. In this timeframe the apg-63 went through several upgrades of all kinds, from software to hardware. One that is not mentioned alot is that in 1978(before PSP) the parametric amplifiers got replaced by FET amps, and ~20% range increase. Thus you'll see 1.2x to reflect it and baseline for the original values. View attachment 784158
On baseline, the 20NM detection seems to be closely to an outlier. It's really close to being highly unlikely through standard deviation, close to 3 when being included in the values but way off when I only take the furthest 19 targets, more than 3 StDs when only taking the 19.
Below without it.
R85 with 1.2x, 54NM
R85 with 1.2x removing outlier, 56NM.
Both things, the Apg 66 and the 1974 APG63 chart, are not generalized. Meaning they are not under the same conditions and modes so a fully direct comparison can't be justly made but we can take a general idea. We know the conditions for the Apg 66 but not for the Apg63.
The 1974 detection range chart doesn't mention closure rate, scan pattern( azimuth and bars) meanwhile the Case study chart is generalized for scan pattern but no closure rate info nor specific target size. With a high closure rate, the Pd curve will be slacker and at a shorter range compared to a low closure rate.
APG 66 info (on flight test) tells use they used a 2bar ±30° scan pattern meanwhile on the case study chart it's done with a 2bar ±60° scan pattern. That's twice the scan time which "lowers" the ranges on the Pd chart.
Even the start range affects Pd charts. APG-66 gives start ranges meanwhile nothing on the other 2.
One thing is for sure, the case study chart is generalized.
Quite a hell of a radar either way, R50 ~61.5NM(126km) for a 3m² target in the 1974, ~73.8NM post 1978. SU27 at R50 is 80-100km a decade later.
However one thing that keeps thinking is the maximum instrumented ranging. On the 1981 -34, the maximum ranging is 86NM and it is backed up by the PSP document that shows the maximum number of range bins for HPRF is 48bins for 100 mile which is ~86 NM. Why so little? Did it get increase later on? I think it did, for example on the apg 65( by 2000) the limit was 99NM.
Do you have the file of "T-33 Radar Cross Section Measurements and Scintillation Analysis"? I cannot find it on internet
Both two sources(Analytic and Concept) you showed me quoted this file.
"ANALYTIC RADAR TARGET MODELING"(R. Mittra, et al, December 1972) and "T-33 Radar Cross Section Measurements and Scintillation Analysis,"(W.A. Pierson and R.W. Clay, February 1972), the frontal cross section of the T-33 front aspect at 8.8GHz(Xband)was theorized at 2 dBms(2.23m^2) and experimentally 0 dBsm(1m^2)(Though the experimental model was a half size model and 6dBsm were added to adjust)
Another 6dBsm. But I just can't find source of measurement, any of them
Besides, one cannot simply 'add 6dBsm' to the result, ratios between the wavelengths and models do matter. I remember in my senior, it was taught about reflection, diffraction, blahblah. The point here is if you change the target size, the behaviors of EM waves change too (Nowadays, when people build stealth jets, they use a full-scaled anechoic chamber for measurement. This fact could be a proof for my point.)
edit: I found some sources claiming that T-33 will be attached with reflector/travel pods when acting as interceptor targets. It's just so confusing jesus im leaving this
edit: Is that half-scaled model made up with same material with the real one?
edit: I've read more files quoting this source, it seems to be an attempt to build up a mathematical method to predict the RCS than measuring the real one? They try to calculate the actual RCS(of the half-scaled model) by decomposing it into some elemental shapes and sum them up.
Do you have the file of "T-33 Radar Cross Section Measurements and Scintillation Analysis"? I cannot find it on internet
Both two sources(Analytic and Concept) you showed me quoted this file.
I've read more files quoting this source, it seems to be an attempt to build up a mathematical method to predict the RCS than measuring the real one? They try to calculate the actual RCS(of the half-scaled model) by decomposing it into some elemental shapes and sum them up.
This site uses cookies to help personalise content, tailor your experience and to keep you logged in if you register.
By continuing to use this site, you are consenting to our use of cookies.


.png")
.png")